Controlling Energy Costs in a Commercial Building
Summary
The biggest users of energy in the average commercial building are Lighting and HVAC (Heating, Ventilation and Air Conditioning). Rates for electricity in most medium to large commercial buildings include both demand and consumption charges, but many energy cost management strategies focus on consumption and miss potentially larger savings available from controlling peak demand in order to reduce demand charges. The focus of this article is to show building owners how to identify and estimate the potential value of Demand Control in their own buildings using data from a utility “smart meter” or a power metering solution. In many cases a Building Automation System that controls HVAC and lighting to manage both electrical consumption and demand can deliver substantial, consistent savings while maintaining building comfort and productivity.
Understanding Energy Costs
Heating, ventilation, and air conditioning (HVAC) and lighting are all essential to a productive building environment and are the two main places energy is typically used in commercial buildings. Commercial facilities including office buildings, hospitals, retail stores, warehouses, medical suites, and the like consume almost 19% of energy used in the United States so lighting and HVAC use a whole lot of energy.
How much energy the lights and HVAC in your own building use will vary depending on the types of mechanical equipment and lighting in place, prevailing climate, timing of use, comfort preferences, building age, windows, insulation, and other site-specific factors. The Department of Energy does provide a national average profile, see Figure 1.
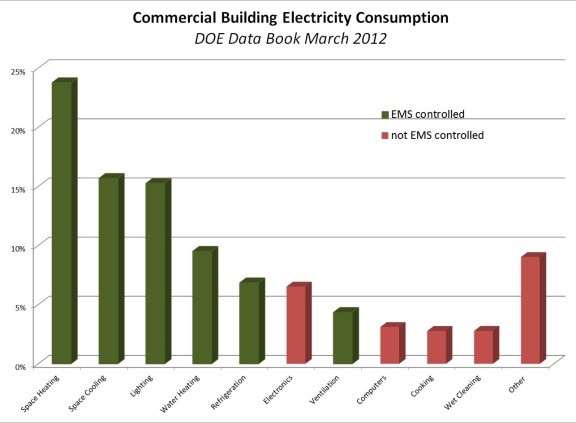 Figure 1 – electricity primary energy use in Commercial buildings
Many commercial buildings are on an electric rate plan or Tariff that includes Demand (capacity) charges as well as energy (consumption) charges. Demand is measured in kilowatts (kW), or thousands of watts, and energy consumption in kilowatt-hours (kWh). A 1,000 watt electric heater creates 1 kW of Demand and if left on for 1 hour it consumes 1 kWh. As a rule residential bills don’t include Demand costs.
Customers often have a choice as to which tariff they are on. Many utilities will provide a rate comparison to tell you how much your bill would be on an alternate tariff, either on your bill, through a web portal, or by request to your utility account rep. Many customers are surprised to find that simply switching tariffs can save them money; the best tariff for a customer will depend on their particular usage profile.
Demand charges in a tariff can be a benefit to some customers with a high load factor, e.g. ratio of average kW to peak kW. We recently identified $40,000 (22%) in annual savings for a senior housing complex in Tucson, AZ by switching from the non-demand metered General Service tariff to the demand-metered Large General Service tariff. In the nearby APS service area we identified how an EMS system combined with a 50 kW solar array would enable a private high school to switch from E32-L to E32-M and significantly cut energy costs. The senior facility has a high peak load factor while the high school has a low load factor so each has a different optimal balance of demand and consumption charges.
Demand costs in a tariff will always be expressed on a $ per kW basis, consumption costs are always in units of $ per kWh. For TOU-8-S commercial customers with 12 kV service in Los Angeles and Orange County, the highest cost for energy on paper is about 13 ½ cents per kWh from noon to 6pm on summer weekdays, but you must add in Demand to see full costs.
[pullquote align=”right”]
TIP – Demand costs are always per kilowatt ($/kW or ȼ/kW), and consumption charges are always per kilowatt-hour ($/kWh or ȼ/kWh).[/pullquote]
EXAMPLE an office in a large building has 8 fluorescent fixtures with 4 T-8 bulbs (32W) each. Those lights are on every weekday from 7am to 7pm all summer. Lights cost $30 to $45 /kW in Demand and about $30 in consumption monthly on TOU-8-S.
Average costs for those lights are roughly 27 to 34 cents per kWh due to Demand costs.
This office adds a 100 W desk light and turns it on from noon to 6pm daily in summer. The first month it costs between $2.40 and $3.90 in Demand and about $1.60 in energy consumption. The average cost for this light is around 33 to 45 cents per kWh.
Timing Matters
The electric utility assesses Demand charges based on peak Demand. Peak Demand is the maximum average Demand over any single 15 minute window in the billing month (sometimes it can be a 30 minute or 1 hour window).
The first example showed how using energy during peak times costs more than the sticker price due to Demand costs, but timing matters in other ways too.
Assume the temperature has been fair all month, so daily energy use looks like the left curve in Figure 2. On the last day of the billing month it gets very hot and the curve resembles the one on the right. The hot day raises the peak about 350 kW, costing an extra $16,000 in Demand costs. SCE offers larger commercial customers some flexibility to select billing period start/end dates, so a timely adjustment to a billing period can save a lot if you have predictable Demand spikes.
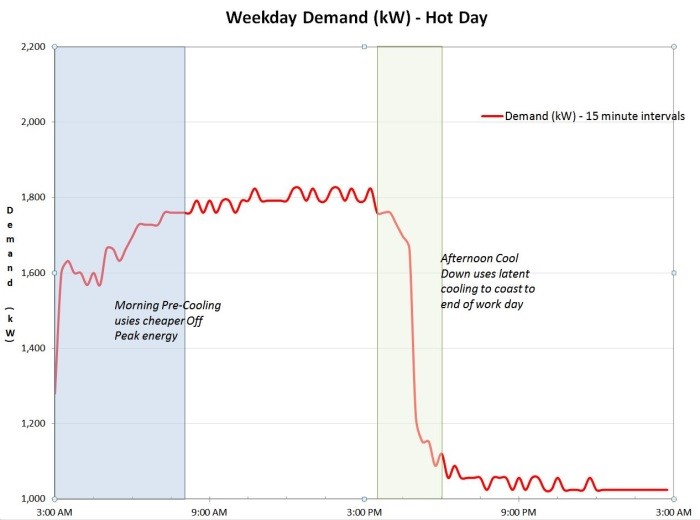 Figure 2.1
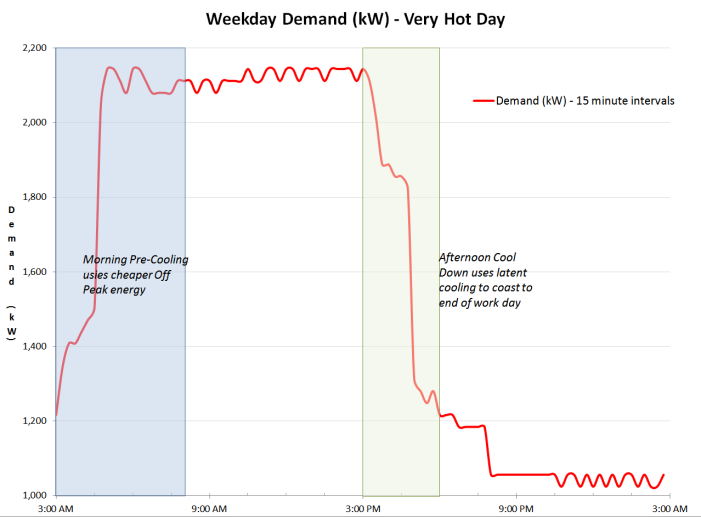 Figure 2.2 - Summer daily Demand in large office building
with central cooling
Figure 2.2 - Summer daily Demand in large office building
with central cooling
Lighting typically lifts Demand level fairly equally throughout a day but HVAC causes electrical Demand to go up and down on hot days, as Figure 2 shows. The variability happens for two main reasons, (1) HVAC systems are staged to match cooling output to cooling need and (2) small changes in airflow have a large effect on energy use.
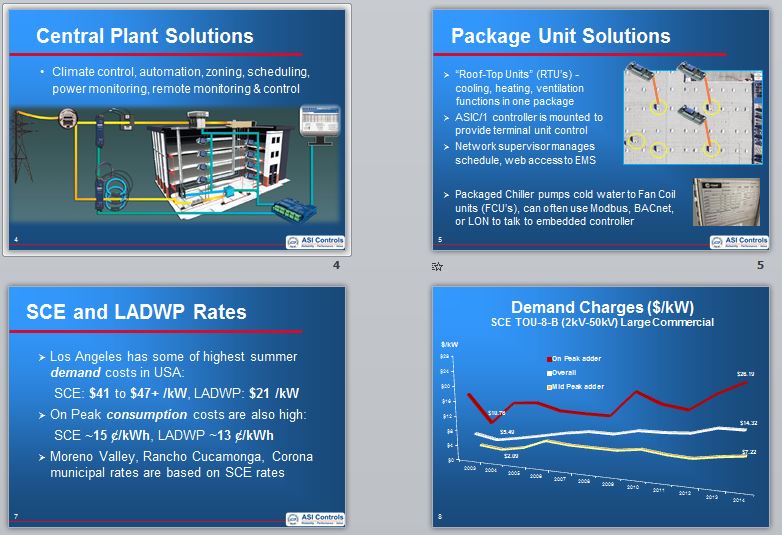
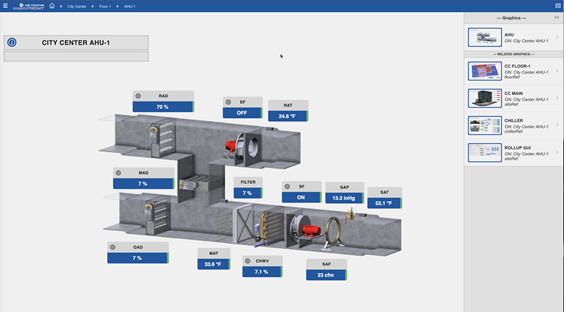
A common cooling setup in large buildings is a large chiller or chillers providing central cooling. Cold fluid is pumped to an Air Handler Unit (AHU) where heat exchangers cool the air before fans push the conditioned air into the distribution ducts. Figure 2 traces Demand for a building with a central plant because changes at the top of the curve are about 32 kW in magnitude, with only 100 kW total variation through the hot part of the day. The chiller comes on early in the day to get pre-loaded when energy is cheap, and is turned down to coast through the afternoon after 3pm or so. Looking at graphs from other days suggests this building has at least two 225 to 250 kW chillers and 3 fans with 40 HP motors.
Another common cooling system is packaged RTU or AHU. A package unit includes compressors, devices that chill air. If more cooling is needed another compressor is turned on, adding a stage. Each compressor on/off event changes electrical Demand.
On hot days a properly sized HVAC system will cycle between stages and even on the hottest days the system alternates between the last and next-to-last stages. Other things being the same the steps in a Demand curve are larger with compressors cycling versus a chiller plant running at a good efficiency. On the other hand the spike in Demand when a chiller comes on dwarfs the spike from an average compressor start.
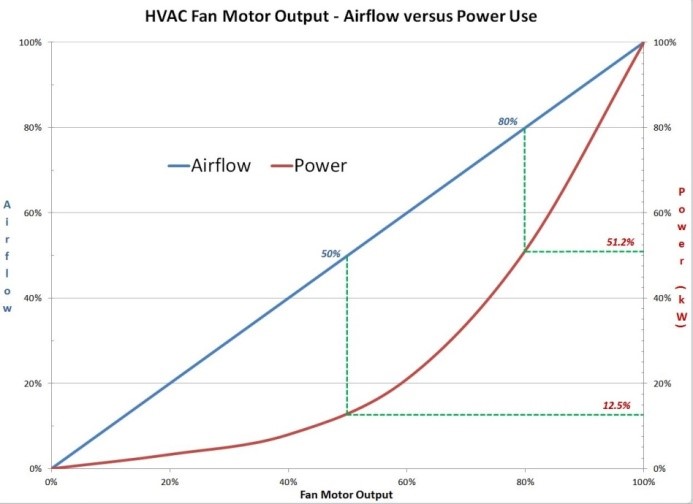
It takes a lot of energy to chill air, and the air distribution system is a second energy hog because the power needed to move air is related to speed cubed (speed times speed times speed). So, small changes in airflow speed have a large effect on power needed.
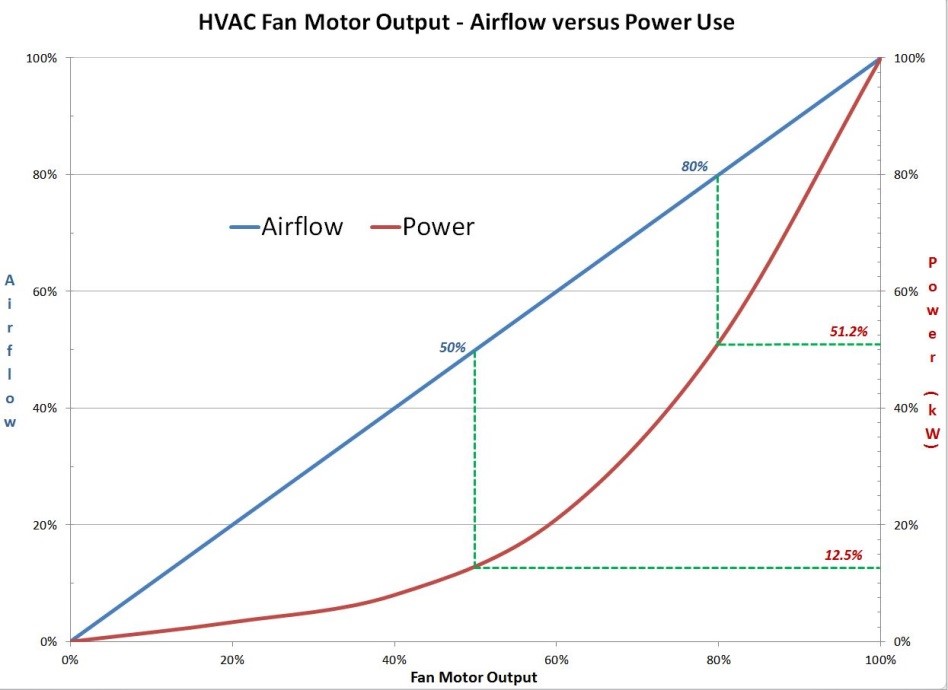 Figure 3
You can feel this in a car on a highway with your hand out the window. There is more resistance at 50 mph than 40 mph, and even more at 60 mph than 50 mph. Each 10 mile per hour rise adds a lot to resistance, if you’ve put a hand out the window while moving at 100 mph you already know this.
If your utility provides detailed or hourly smart meter data, or you have a BAS or EMS trending your Demand, you can probably figure out the kilowatt draw for each stage in your air conditioning by looking at the stair steps in Demand.
You can also figure out how much power the HVAC draws from the nameplate which tells you unit Voltage and phases, count of compressors, and the Horsepower (HP) and Full Load Amperage (FLA) for each compressor, motor and pump in the system. The FLA is the current the device draws at full load; you can use online converters to translate FLA and voltage into a kW value for a device. Alternately, multiply motor HP by 0.746 (1 HP = 746 watts) to get estimated kW for each compressor, motor or pump. A low Power Factor raises wire losses and creates potential issues with motor wear, transformer overloads and voltage sag, but that topic needs another article to explain.
A model number search often leads to a manual with more detailed specifications.
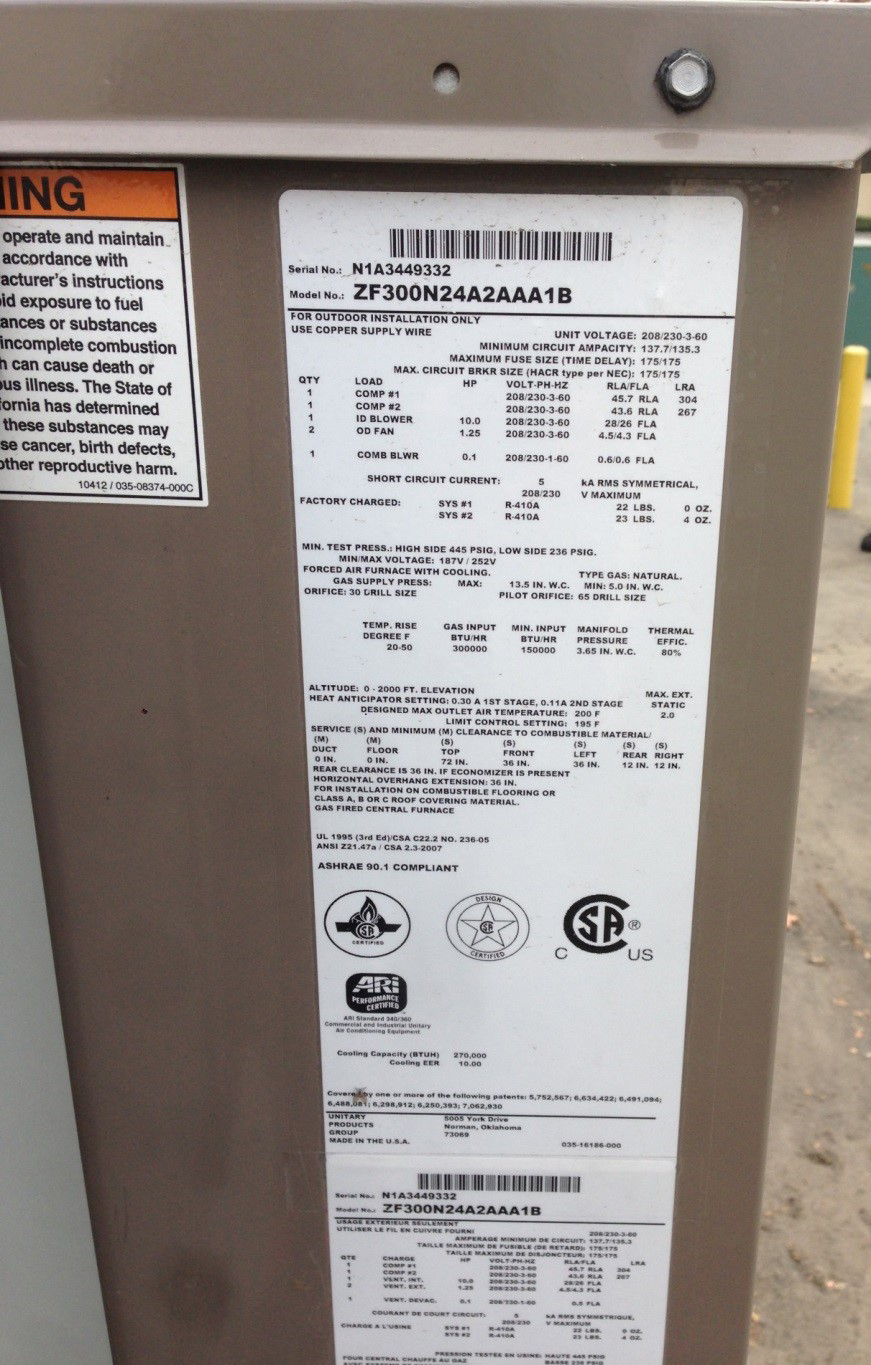 Figure 4.1
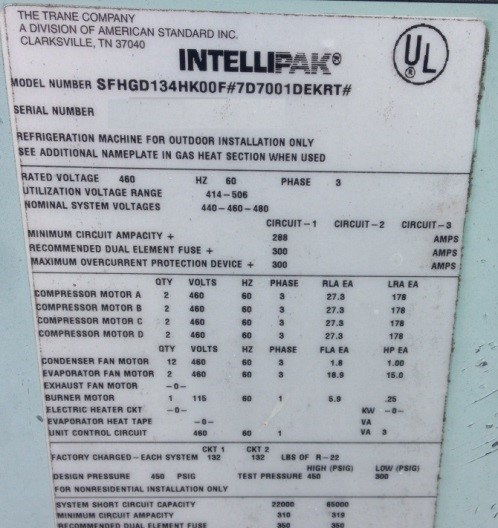 Figure 4.2
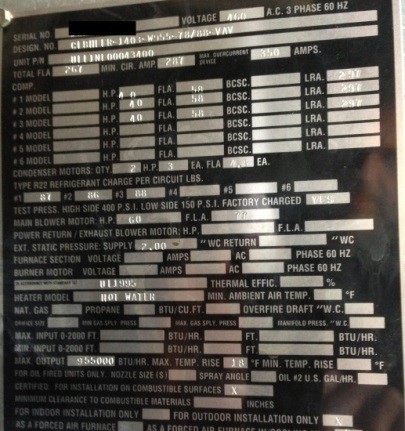 Figure 4.3
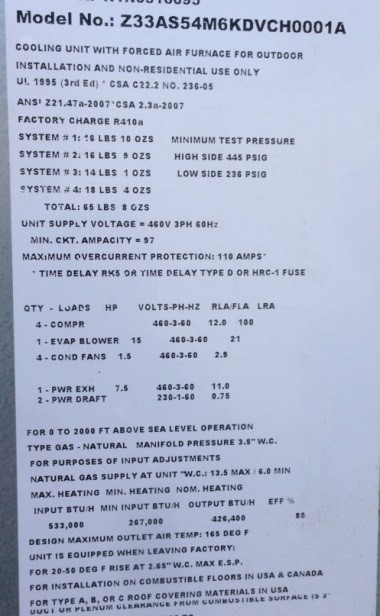 Figure 4.4 - examples of RTU and AHU nameplates
An Energy Management System with Demand Control features offers the capability to set a limit on the amount of Demand the system can create. The EMS can follow pre-selected choices for which systems to ramp down and what to turn off in the event load shedding is needed to keep the building under a Demand limit. Energy storage solutions provide the EMS with more options to serve a load surge versus shedding Demand.
In Los Angeles, SCE large commercial customers pay some of the highest Demand charges in the USA but other utilities like PG&E and SDG&E in CA are over $30/kW in summer. APS E32-L in AZ has a $35.43 /KW rate on the first 100 kW and $23.37 /kW on the balance, with a 12 month ratchet clause. The HECO (HI) rate is near $24 /kW, TEP (AZ) LGS-13 rate is $15.25 /kW, PSEG (NJ) LPL rate is almost $20 /kW in summer and $15 /kW in other months and CP&L (CT) rate 56 charges about $14 /kW.
These are the highest demand charges in the US, but even with lower demand charges you probably overpay for the energy you need if your peak demand is unmanaged.
Public utilities are required to make their rates public so you can find all the details of most tariffs online. Many utilities have an online customer portal that allows you to compare what your costs would be on a different Tariff or Rate Plan.
If you have a utility smart meter your utility most likely already offers simple ways to download the meter data. With demand data at 15 minute or hourly intervals you can learn a lot about how your building operates. In many cases a few simple actions to limit peak demand can help control your energy costs without sacrificing comfort or compromising business needs.
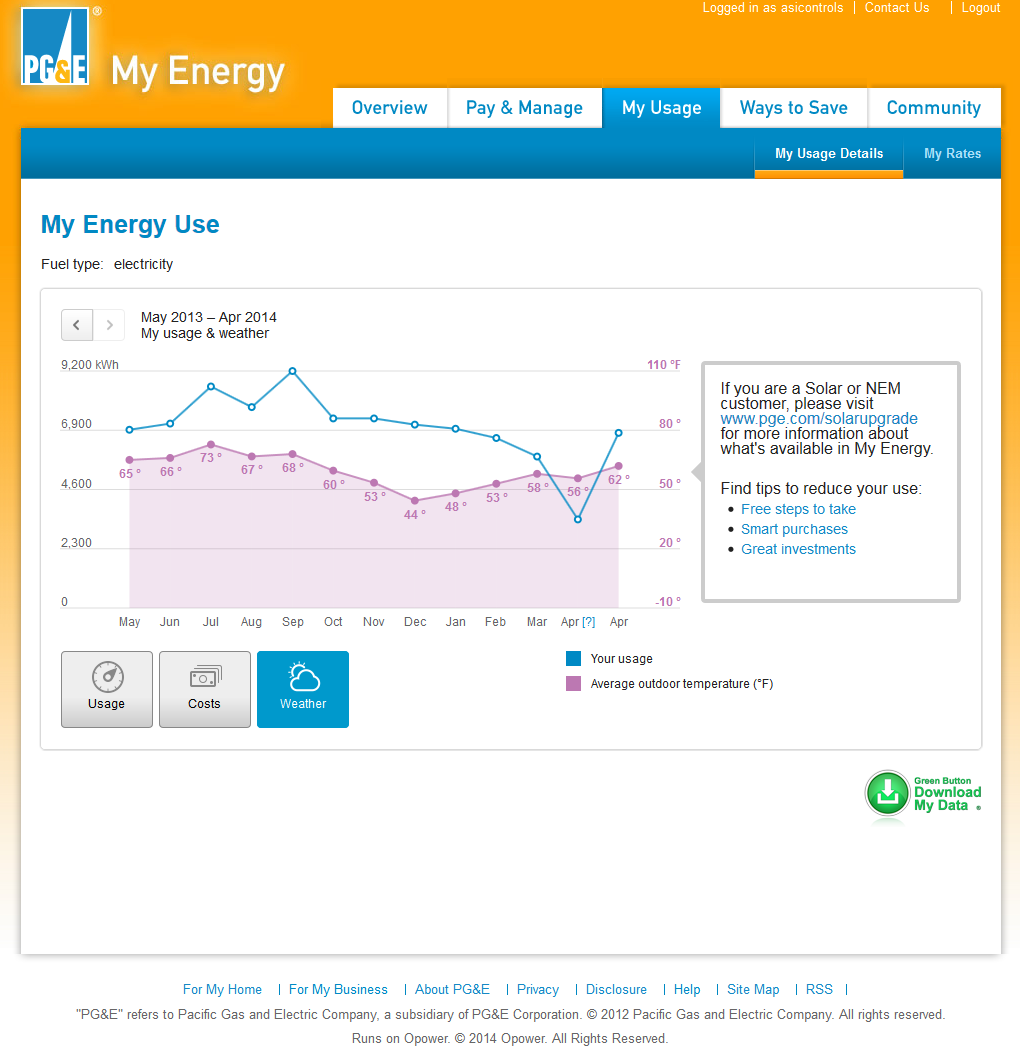 Figure 5.1
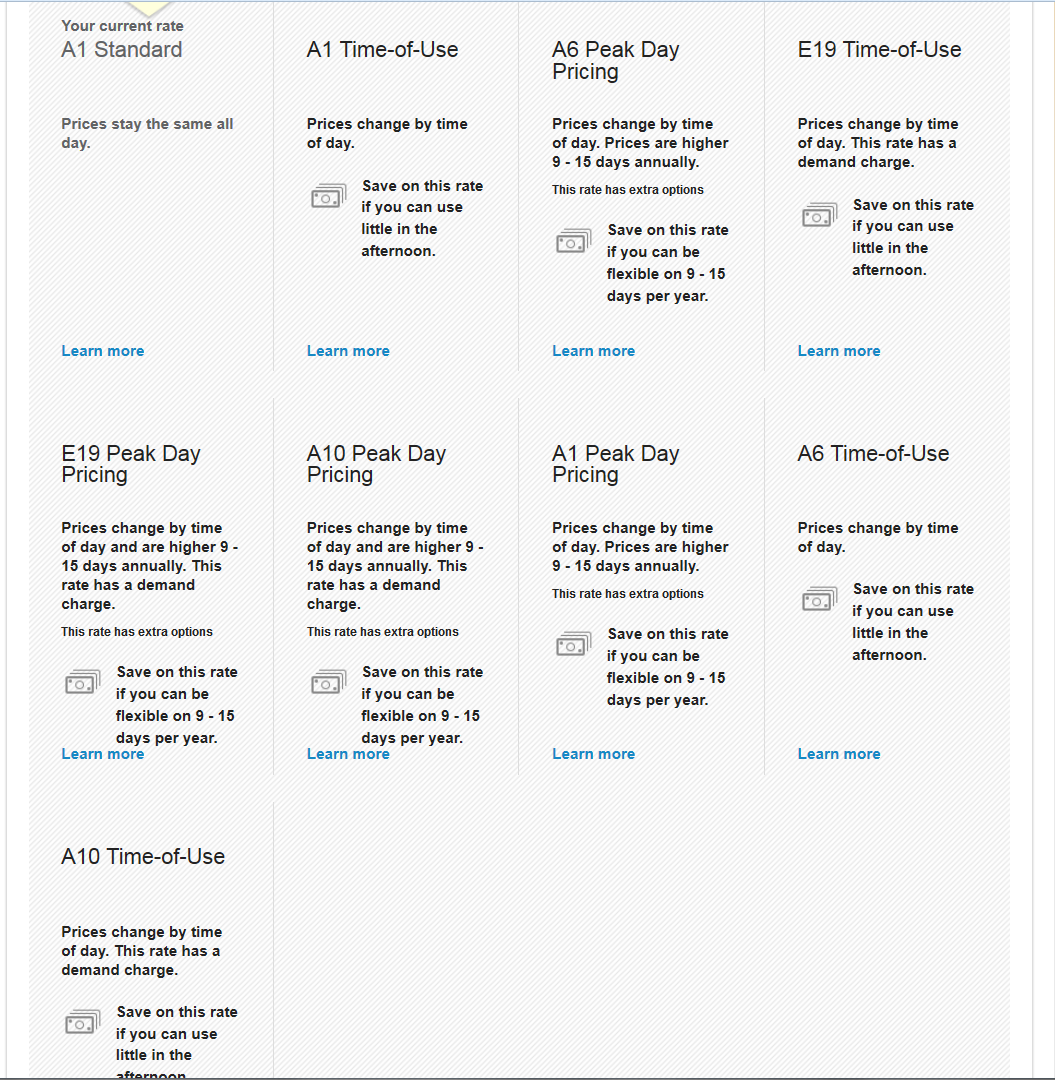 Figure 5.2 – PG&E (CA) customer portal pages for A1 Standard (small
commercial) only provide consumption data
Figure 5.2 – PG&E (CA) customer portal pages for A1 Standard (small
commercial) only provide consumption data
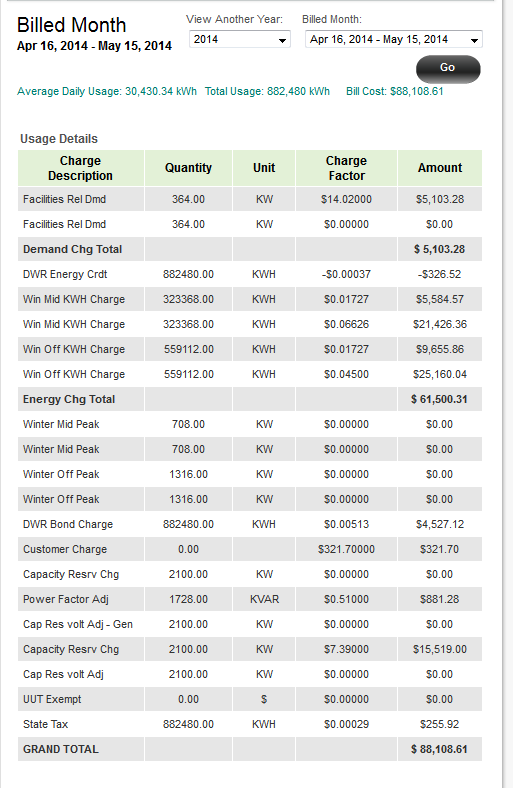 Figure 6.1
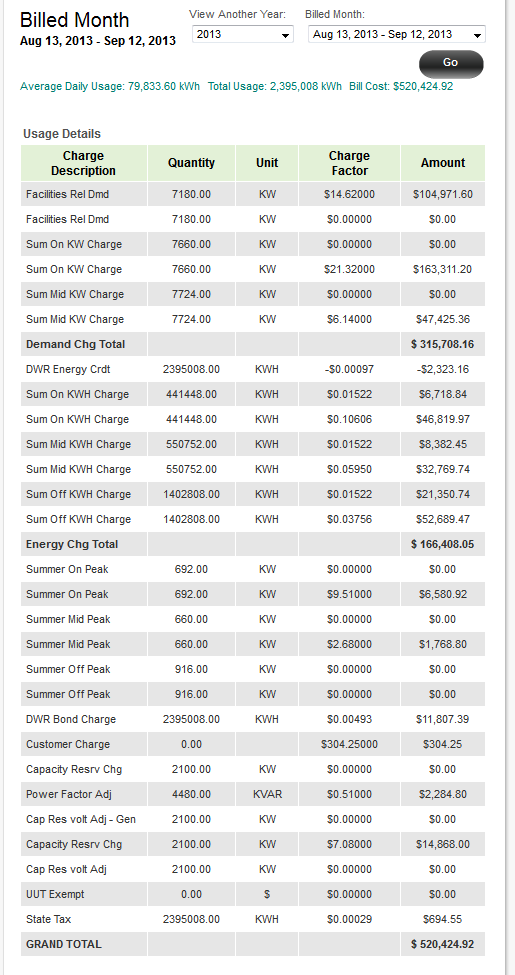 Figure 6.2 – SCE (CA) gives TOU-8-S (large commercial) customers useful
details on demand and consumption charges
Figure 6.2 – SCE (CA) gives TOU-8-S (large commercial) customers useful
details on demand and consumption charges
The quality of data available from your customer portal can vary by utility company and by Tariff or rate plan. The PG&E customer in this example does not have a smart meter installed yet and is on A1 tariff which does not include a demand charge. If they click on the “green button” to download data they only get monthly bill totals. Bill totals and aggregated consumption data are not very helpful for cost savings analysis. High level data can help if cost control focuses on conserving energy, but our goal is to show how if you are on a tariff with demand costs then controlling peak demand can often cut costs significantly without requiring energy conservation. Figuring out an effective demand control strategy requires detailed demand data.
The SCE customer on TOU-8 tariff in Figure 6 has a smart meter and can download meter data at 15 minute intervals for the last 13 months. This is valuable data and knowing how to interpret it can help you devise potential savings strategies.
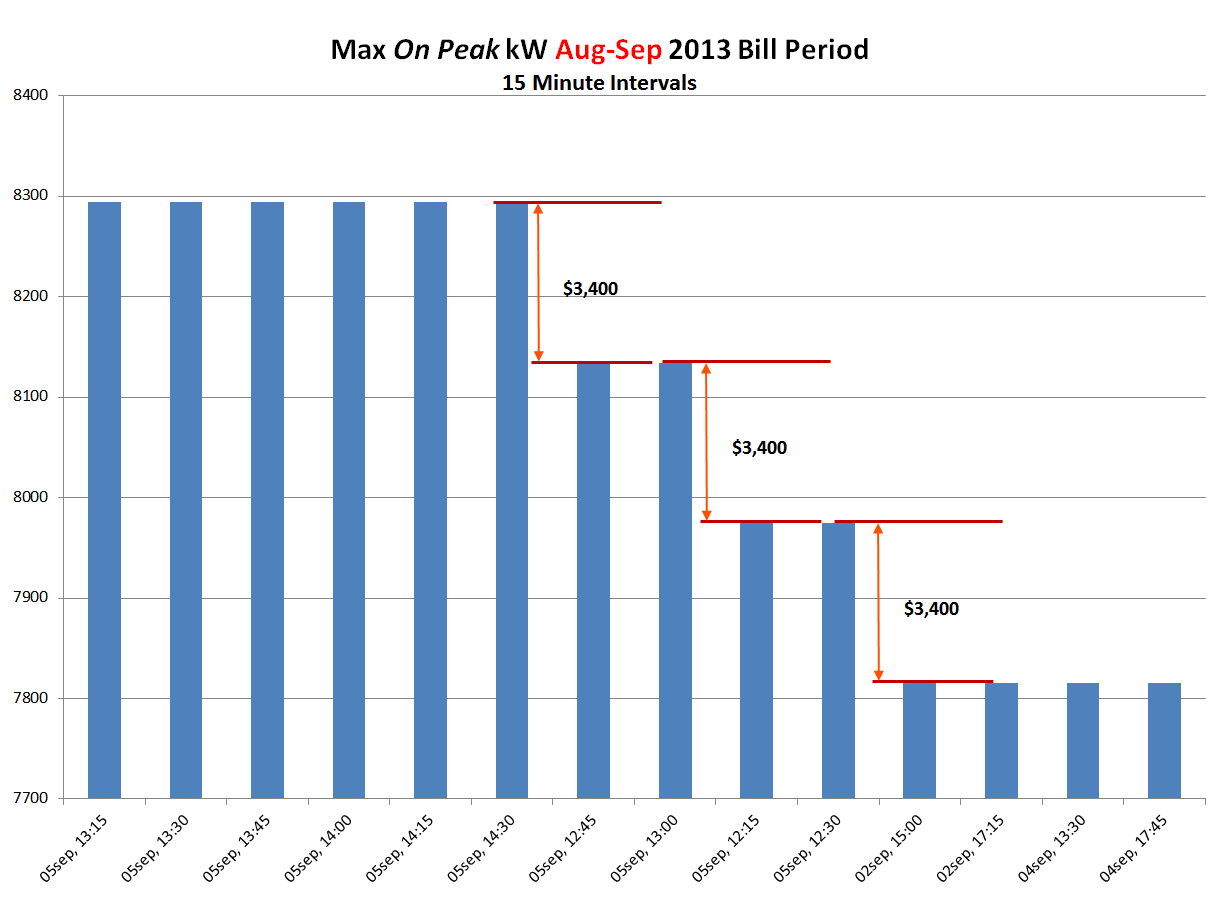 Figure 7 – data shows $10,000 savings to SCE TOU-8-S customer if demand
limited up to 480 kW (6%) for 2.5 hours on 1 day
Figure 7 – data shows $10,000 savings to SCE TOU-8-S customer if demand
limited up to 480 kW (6%) for 2.5 hours on 1 day
If you don’t have a utility smart meter, or you are part of a large utility account and don’t have sub-metering data, you can install your own power meter or power data logger to get a detailed profile of your building electrical use. Having detailed demand data is essential to figuring out if and how you can run your building more cost effectively. In rare cases customers have even been able to reverse utility billing errors using data from their own power meters.
Hopefully you have learned how to look at information available to you to get an idea of how your building operates today and perhaps you even feel prepared to try controlling Demand manually to test your savings potential. If Demand cost is driving your bills an automated Energy Management System oriented to Demand control can help you manage energy costs comfortably and efficiently. An ASI Controls authorized reseller can help you run through the numbers and calculate projected savings from an automated EMS.


 Upgrade to an enhanced user experience with IntelliFront 4.5. The 4.5 release offers intuitive a user experience enriched with new features such as an app launcher menu, simplified alarm badge navigation, add/remove favorite views, and the ability to save an existing graphic as a new entity using the Save As Graphic tool.
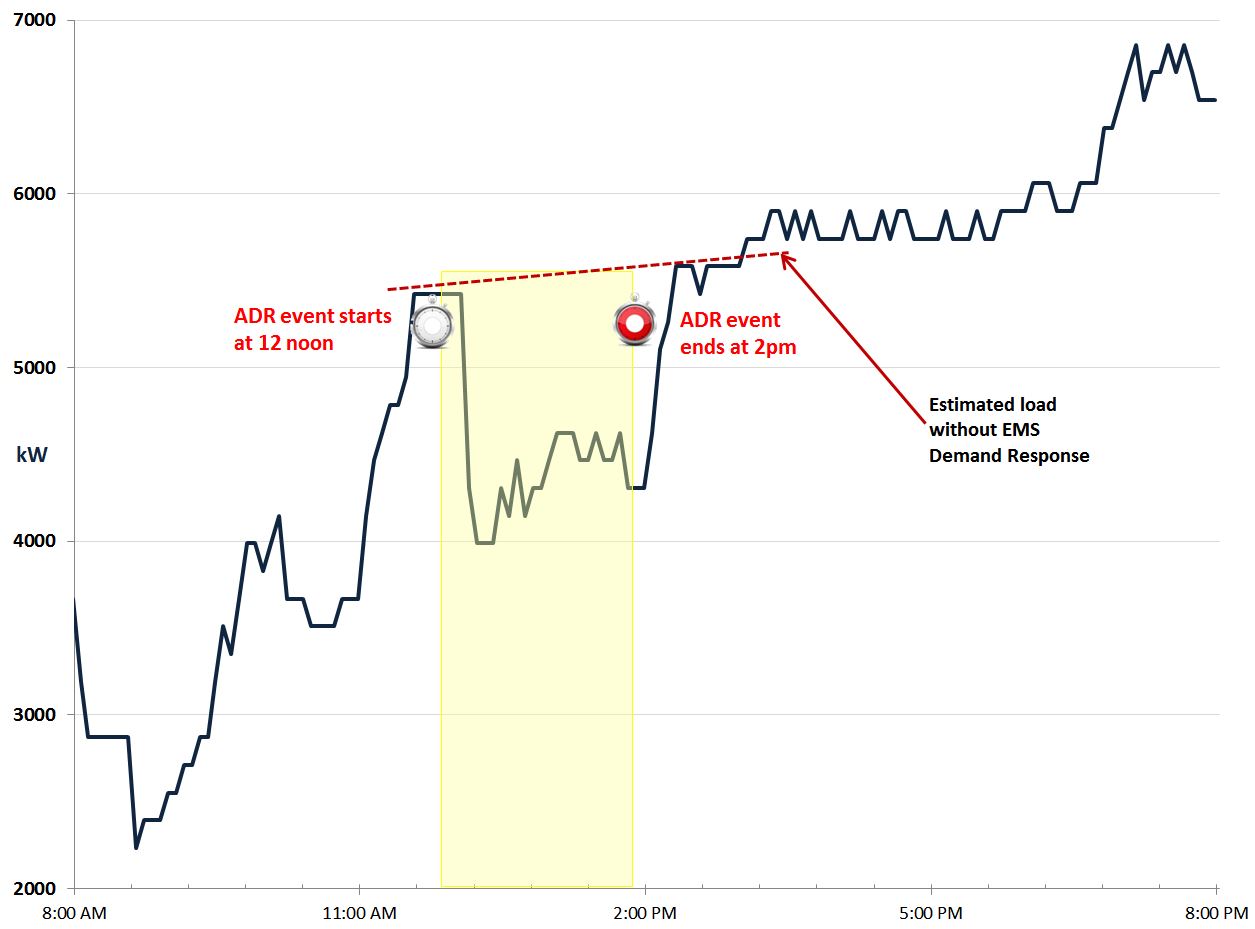 ct (DEM) in ASIC/2 and ASIC/3 programmable controllers is easily configured to trigger demand response load reductions by changing zone setpoints. In addition to satisfying CA requirements, this feature helps deliver automated energy cost savings in areas with high demand costs.
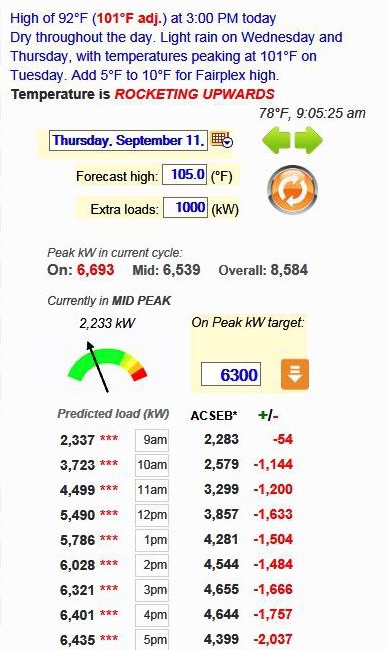 of calculating baselines to know if participation will be profitable and the need for manual intervention in the process to trigger load reductions both limited the potential payback of first generation demand response solutions. Today however customers can use the OpenADR protocol to receive a signal via Internet and automatically trigger demand response actions by the energy management system. Incentives and subsidies for OpenADR solutions are available to help pay for a new EMCS or to add functionality to an existing system.
 Y994i, was added to the ASI Controls price list to provide an OpenADR 2.0 (b) interface for ASI Controls EMS systems. The device can interface to the EMCS via controller inputs to trigger demand reductions. Requiring an OpenADR interface for a commercial building is a step on the road to an eventual SmartGrid where buildings pay for demand and energy based on real-time market conditions, and can also potentially sell demand response yield back to the grid.